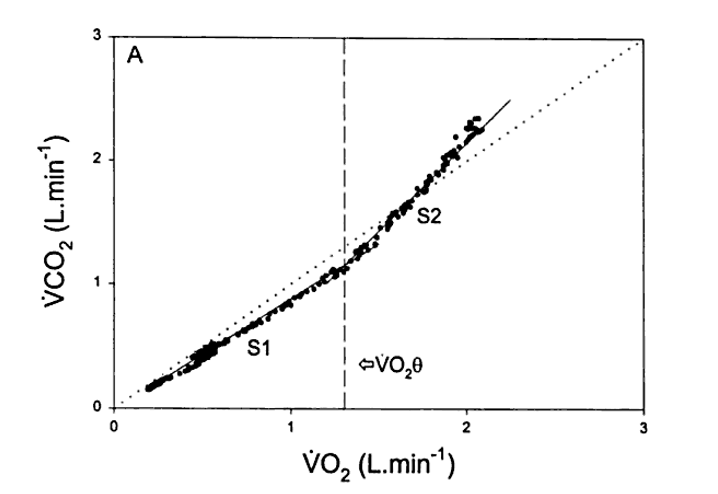
normal VO2 VCO2 graph in CPET related: cardiopulmonary exercise test CPET tags: #permanent #pulmonology 1 VO2 increases linearly with VO2 increase until anaerobic threshold is reached. Then VCO2 increases faster Links to this note cardiopulmonary exercise test CPET normal VO2 VCO2 graph in CPET Footnotes A Practical Approach? ↩