power and confidence level of research
- related: Biostats and Study Design
- tags: #literature #biostat
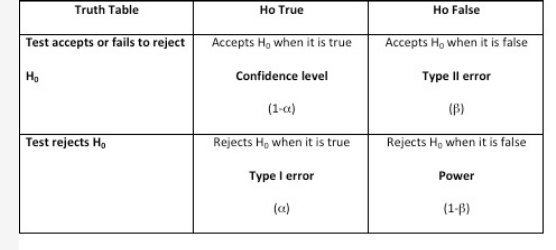
Hypothesis testing is important when performing empirical research and evidence-based medicine. There are two types of statistical hypotheses: the null and the alternative hypotheses. The null hypothesis is denoted by H0 and it is usually the hypothesis that sample observations result purely from chance. The alternative hypothesis, denoted by H1 or Ha, is the hypothesis that sample observations are influenced by some nonrandom causes. In any hypothesis testing, there are four possible outcomes (Figure 1). The power of the test is the probability that the test will reject the null hypothesis when, in fact, it is false. Having a high value for 1 − β (near 1.0) means it is a good test, and having a low value (near 0.0) means it is a poor test. Conventionally, a test with a power of 0.8 is considered acceptable. In addition, when a test accepts the null hypothesis when it happens to be true, it is called confidence level denoted by (1 − α). A Type I error (also called the significance level and is usually denoted by α) occurs when the researcher rejects a null hypothesis when it is true. A Type II error (also called β) occurs when the researcher accepts the null hypothesis that is false.1
The power of a clinical trial refers to the probability of detecting a difference between two groups in a study when a difference truly exists. In other words, power is the likelihood of avoiding a type II error, in which the null hypothesis is incorrectly accepted (ie, no difference is found between two groups, but a difference truly does exist). A power value is set prior to beginning a clinical trial, and this value is used to determine the planned sample size. By convention, clinical trials almost always establish a power value between 80% and 90%. After selecting the acceptable power value for a study, a sample size can only be estimated after investigators predetermine the expected difference in measurement of the primary outcome between the two study groups (ie, expected treatment effect). Other variables that are necessary for determining sample size based on a selected power value include the SD of the measurement within the study population, the acceptable probability of a type I error (α, often set at <), and the type of statistical test being performed to measure differences. If a planned sample size is determined using an unrealistically large anticipated treatment effect, the study is more vulnerable to a type II error in hypothesis testing, despite reaching its stated sample size enrollment goal and despite reporting a standard power value of 80% used to determine this sample size (choice D is correct).
It is not appropriate to recalculate a study’s power using the observed treatment effect from a trial that is already complete, a practice sometimes referred to as post hoc power calculation (choice C is incorrect). While this practice is sometimes seen in the medical literature, this calculation is typically regarded as uninformative. Because the concept of pretrial power is defined as the probability of detecting any one of all the potential trial outcomes in which the difference in groups is significant (when a different truly exists), it cannot be meaningfully applied to a single posttrial outcome. In addition, after a nonsignificant difference has already been observed in a clinical trial, which is the typical scenario in which post hoc power calculations are pursued, conducting a power calculation will always demonstrate a low power value and thus will add no meaningful information to the evaluation of the study.
The investigators in this trial conclude that the medication did not reduce the primary outcome of 28-day mortality, and this conclusion is not affected by how long the trial took to enroll subjects (choice A is incorrect) or secondary outcomes that were explored in the trial (choice B is incorrect).
You are reading a newly published randomized controlled trial of a medication that treats ARDS. This new publication presents the results of a phase III trial during which the novel medication was compared with placebo. The study investigators met the patient enrollment goal to achieve 80% power. The primary outcome was 28-day mortality, and the trial found no significant difference between the novel medication group and the placebo group. The investigators concluded that treatment with the novel medication does not reduce 28-day mortality in ARDS.
Which of the following should be used to evaluate the validity of the investigators’ conclusion?
