receiver operating characteristics curve
- related: Biostats and Study Design
- tags: #literature #biostat
The sensitivity (true-positive rate) and specificity (true-negative rate) of a diagnostic test depend on the threshold at which the test is considered positive. Setting the threshold at a low test value can result in a test that is very sensitive but lacks specificity; in other words, one may falsely classify too many patients without the disease as having the disease and therefore treat people who do not need treatment. By contrast, setting the threshold at a high test value can result in a test that is very specific but lacks sensitivity; in other words, one may falsely classify too many patients with the disease as not having the disease and therefore not treat patients who should be treated. The receiver-operating characteristic (ROC) curve provides both a mechanism for comparing one diagnostic test with another and a mechanism for choosing the most appropriate threshold or cutoff level for the test (Figure 1).
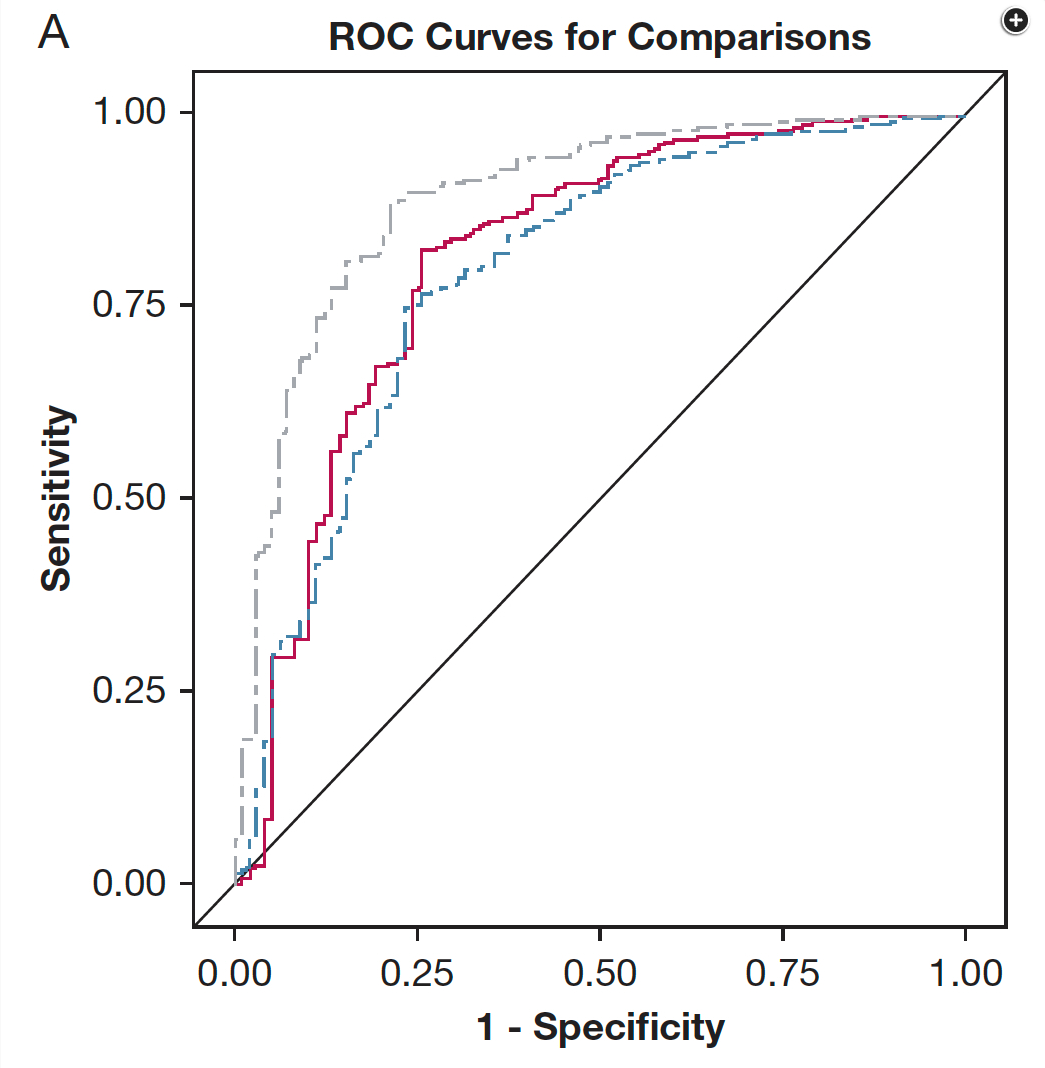
The ROC represents a plot of all potential thresholds of positivity for the diagnostic test, demonstrating, at each threshold, the trade-off between sensitivity and specificity of the test, at that specific test value. The y-axis of the curve represents sensitivity, or true-positive rate, while the x-axis represents (1 – specificity), or false-positive rate. Figure 1 shows the ROC curve for one United States Food and Drug Administration (FDA)-approved sepsis diagnostic test. The ROC curves for three different potential diagnostic tests, including the approved one, are illustrated, and the curves are convex upward and to the left. A hypothetical test with perfect sensitivity and specificity would be square, with vertices at the origin, at a sensitivity of 1, and at (1 – specificity) of 1. A test with no discriminative ability—that is, with equal probability of being positive (or negative) in either a patient with sepsis or a patient without sepsis—results in a diagonal connecting the origin (lower left of the graph), at which the sensitivity is 0, with the upper right corner of the graph, at which specificity is 0 and (1 – specificity) is 1. This diagonal is also illustrated in Figure 1.
ROC curves are commonly used to compare diagnostic tests, as illustrated in Figure 1 by three separate curves. The useful comparison is the AUROC, also known as the c-statistic. The AUROC gives the probability that if one randomly selects a patient with the disease and a patient without the disease, the patient with the disease will have a higher test value than the patient without the disease (choice C is correct). Tests with higher AUROC have an overall higher predictive ability, or ability to separate patients with disease from those without disease (nondisease).
The AUROC does not by itself provide information regarding what threshold value should be chosen for separating disease from nondisease, or calling a test positive versus negative. Instead, a parameter called Youden index is calculated. Youden index chooses the point on the ROC curve that is geometrically nearest to the upper left corner of the graph, that is, the point that best balances sensitivity with specificity (choice D is incorrect). Without having chosen the threshold value, no information can be given regarding the proportion of patients with sepsis detected by the new test, that is, the true-positive rate, or sensitivity (choice A is incorrect). Likewise, without having chosen the threshold, one cannot determine the false-positive rate, true-negative rate, or false-negative rate (choice B is incorrect). Once a threshold value is chosen, all of these parameters can be determined.
Increasingly in sepsis diagnostics, the FDA is requiring that results be expressed in bands of likelihood ratios, rather than as a unique diagnostic threshold value. The likelihood ratio expresses the fold likelihood that a patient with the given test result has the disease in question—in this case, sepsis—in comparison with the likelihood that a patient without disease would have this test result. The likelihood ratio is calculated as sensitivity/(1 – specificity), in other words, (true-positive rate)/(false-positive rate). Likelihood ratios >10 are generally considered diagnostic of disease presence, while ratios <0.1 are generally considered to rule out the disease. Notably, higher test result values will be clustered in the lower left of the ROC curve and lower test result values will be clustered in the upper right. The shoulder of the curve represents the most indeterminate portion. High-likelihood bands are derived from the left, ascending arm of the ROC curve, while low-likelihood bands derive from the upper, horizontal arm and the intermediate band derives from the shoulder of the curve. The likelihood ratio helps to sort through sensitivity, specificity, and positive and negative predictive values, because it is not affected by disease prevalence and allows the test to be used with a range of pretest probabilities. However, in diseases with very low prevalence (ie, very low pretest probability), even likelihood ratio is inaccurate. This is not the case with sepsis.1234
The area under ROC represents accuracy of the test (the number of true positives plus true negatives divided by the number of all observations). An accurate test would have area under the ROC close to 1.0 (rectangular shape) whereas a test with no predictive value would be represented by a straight line (see Fig. 5).
Fig. 5. Two receiver operating characteristic (ROC) curves are shown. Curve A has area under the curve close to 1.0 and represents an accurate test. Curve B has area under the curve of 0.5 and lacks predictive value.
Another important indicator of test performance is the likelihood ratio. The positive likelihood ratio is calculated by dividing sensitivity by (1-specificity). A positive likelihood ratio of 9 indicates that a positive test result is seen 9 times more frequently in patients with the disease than in patients without the disease. Unlike predictive values, the likelihood ratio is independent of disease prevalence.
Links to this note
Footnotes
-
Cook NR. Use and misuse of the receiver operating characteristic curve in risk prediction. Circulation. 2007;115(7):928-935. PubMed ↩
-
Crouser ED, Parrillo JE, Seymour C, et al. Improved early detection of sepsis in the ED with a novel monocyte distribution width biomarker. Chest. 2017;152(3):518-526. PubMed ↩
-
Mandrekar JN. Receiver operating characteristic curve in diagnostic test assessment. J Thorac Oncol. 2010;5(9):1315-1316. PubMed ↩