stress index in ventilators
- related: understanding of ventilators
- tags: #literature #icu #pulmonology
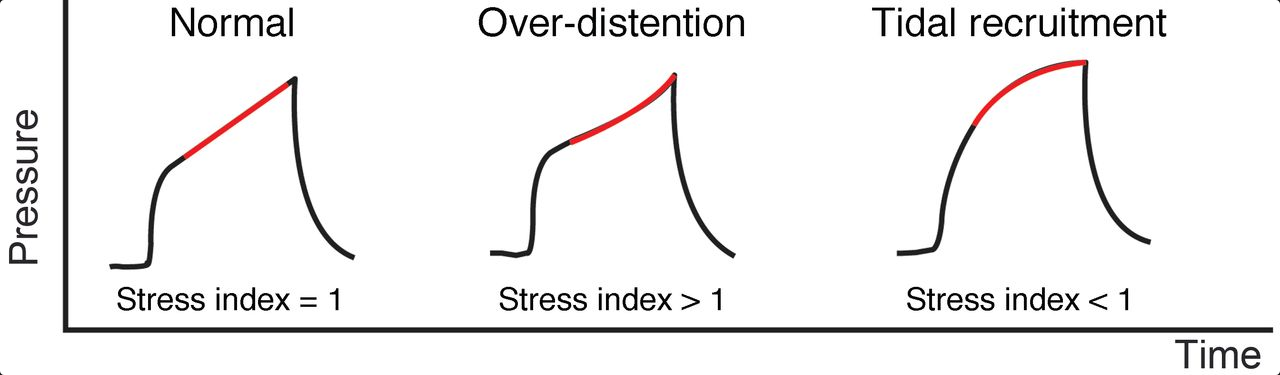
This parameter is the slope of the airway pressure graphic during inflation with a volume controlled breath (no patient effort) using a constant inspiratory flow. For measurement of the stress index, inspiratory flow is often set at a very low value (e.g. 25 L/m) to minimize flow-related pressures. Adjusting the ventilator according to the stress index during ARDS has not been shown to improve patient-centered outcomes.
Under these conditions, the airway pressure slope represents respiratory system compliance during the tidal breath. If it slopes upward (worsening compliance) it suggests tidal overdistention. If it slopes downward (improving compliance) it suggests recruitment during the tidal volume. Ideally, the slope should be linear, suggesting a stable compliance during the tidal breath. The stress index of greater than 1 (similarly, the elevated plateau airway pressure) raises the possibility that PEEP is excessive; alternatively, tidal volume may be excessive. Focusing solely on PEEP is also not appropriate.
Importantly, using DP to target tidal volumes settings has not been subjected to a prospective randomized trial as yet. Such a trial would randomize patients with a plateau pressure <30 cm H2O and receiving a Vt of 6 mL/kg IBW but with a high DP to either remain on 6 mL/kg or have the Vt reduced further to reduce DP.
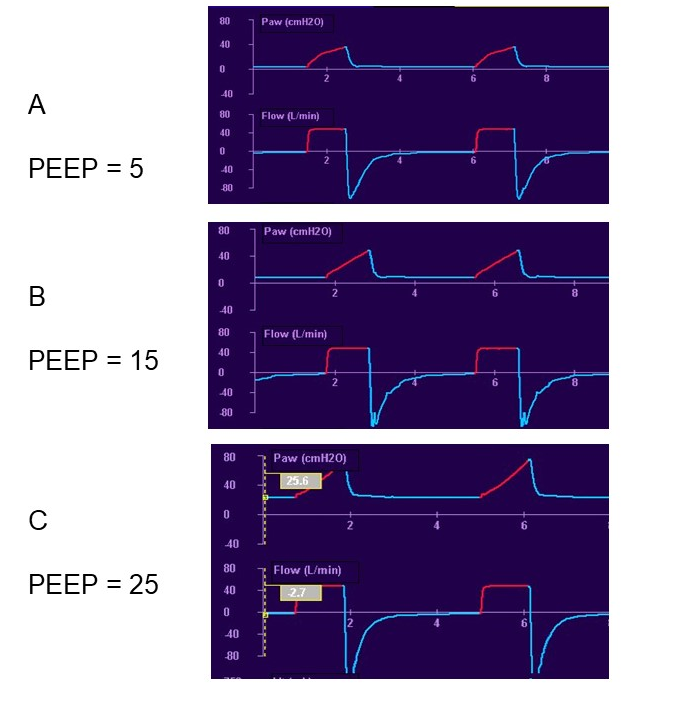 Constant flow, volume controlled breaths (no patient effort) during three levels of PEEP to assess the stress index – the slope of the airway pressure tracing. In tracing A (PEEP = 5), the airway pressure graphic slopes downward indicating recruitment is taking place and suggests adding PEEP. In tracing C (PEEP = 25), the airway pressure graphic slopes upward indicating overdistention is occurring and suggests reducing PEEP. In tracing B (PEEP = 15), the airway pressure graphic is linear, indicating compliance is constant during the breath and suggests PEEP is appropriate.1
In case 1, the decrease in PEEP from 14 cm H2O to 10 cm H2O while receiving pressure-control ventilation was accompanied by an increase in exhaled tidal volume (Vt) from about 435 mL to 530 mL. VT is the dependent variable in pressure-control ventilation, and a decrease in PEEP should result in increased Vt if overdistention was present with the higher PEEP setting, as observed. In contrast, decreasing PEEP should result in falling Vt if alveoli are derecruited, favoring maintaining the higher PEEP setting. Accordingly, in case 1, the findings do not support a higher PEEP setting, which was likely accompanied by overdistention.
In case 2, an increase in PEEP from 12 cm H2O to 14 cm H2O while receiving volume-control ventilation was accompanied by an increase in plateau pressure (Pplat) from 25 cm H2O to 30 cm H2O. This excessive increase in Pplat compared with the increase in PEEP (ie, 2.5-fold higher increase in Pplat vs PEEP) is evidence that the higher PEEP is accompanied by overdistention, which now necessitates a higher driving pressure to produce that same Vt. This reflects worsening lung compliance with higher PEEP.
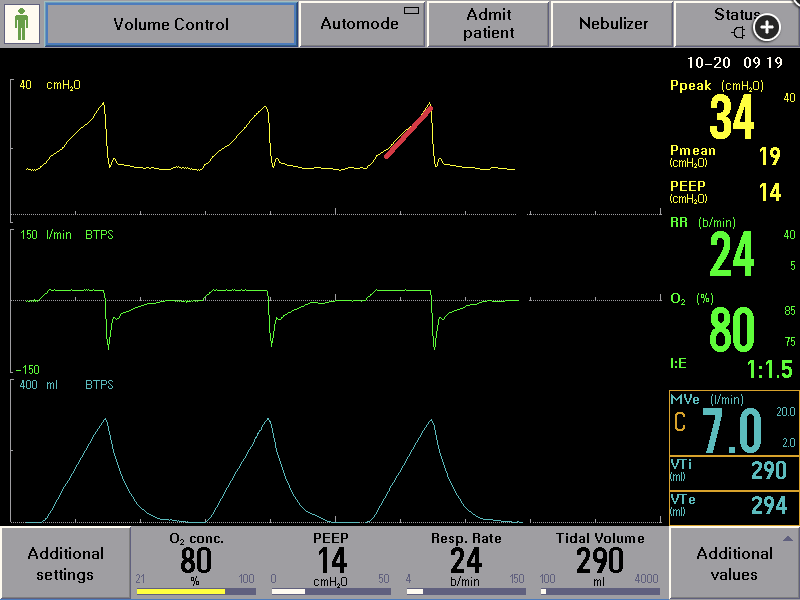
In contrast, successful recruitment and retention of alveoli as a result of more PEEP would be expected to require lower driving pressure for the same Vt, because lung compliance is improved after alveolar recruitment. Accordingly, the magnitude of increase in Pplat should be the same as or less than the increase in PEEP to support using the higher PEEP setting. The pattern of change in airway pressure as the lungs are inflated with volume-control ventilation using a constant inspiratory flow rate (square wave pattern) provides clues as to the likelihood of overinflation. A concave upward contour of airway pressure vs time (with constant flow) suggests overinflation is present, because proportionally higher pressure is required to complete lung inflation. In case 2, the pressure contour is flat to slightly concave upward.
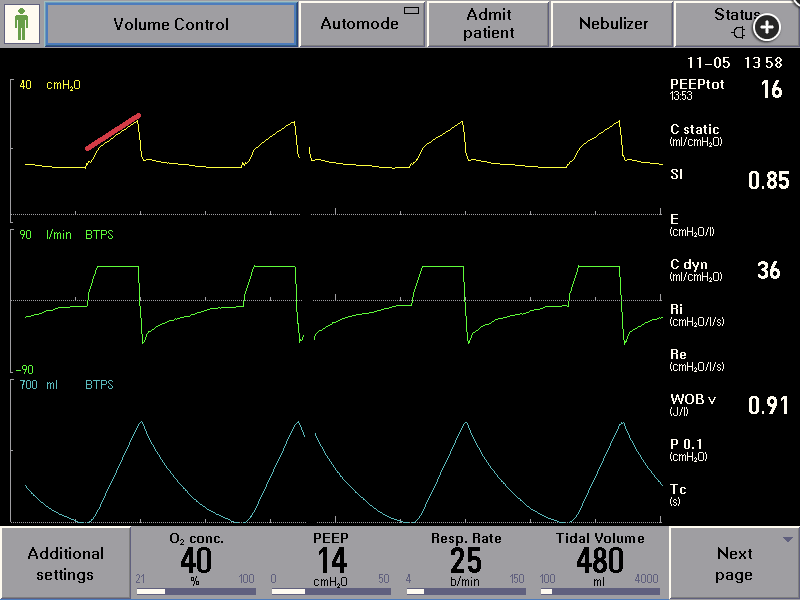
In case 3, during the increase in PEEP from 10 cm H2O to 14 cm H2O while the patient received volume control ventilation with constant flow, the contour of inspiratory pressure vs time tracing showed a concave downward shape, indicating relatively modest increase in airway pressure as the lungs were fully inflated. To summarize, there is clearly no evidence of overdistention. In an effort to better standardize the pressure vs time contour, the slope of change in airway pressure over time as the lungs are inflated with constant flow can be graphically depicted and expressed numerically by the stress index (SI). A flat rise in airway pressure has an SI of 1.0, whereas a concave upward contour has an SI >1.0 and a concave downward countour has an SI <1.0. The relationship of SI to alveolar recruitment and to overdistention has been validated. One can approximate the SI by visualizing the pressure-time waveform. This process can be enhanced by placing a line over the ascending limb of the pressure-time tracing. In case 3, the contour is clearly concave downward, consistent with SI <1.0 (Figure 8, red line). In contrast, the contour is flat or slightly concave upward, consistent with SI = or >1.0 for case 2 (Figure 7, red line). Many ventilators incorporate an automated measurement and display of SI. In case 3, visual inspection reveals a concave downward pressure-time contour and the ventilator calculated SI is nearly unchanged (0.83 before and 0.85 after) with increased PEEP and remains <1.0. This supports the concept that increasing PEEP is likely to be beneficial for alveolar recruitment and is not causing overinflation.2345
- Stress index vs flow dysynchrony
- Stress index is how much recruitable lung is left in volume control
- Premature cycle: TV too low
Links to this note
Footnotes
-
Grasso S, Stripoli T, De Michele M, et al. ARDSnet ventilatory protocol and alveolar hyperinflation: role of positive end-expiratory pressure. Am J Respir Crit Care Med. 2007;176(8):761-767. PubMed ↩
-
Henderson WR, Chen L, Amato MBP, Brochard LJ. Fifty years of research in ARDS: respiratory mechanics in acute respiratory distress syndrome. Am J Respir Crit Care Med. 2017;196(7):822-833. PubMed ↩
-
Sun XM, Chen GQ, Chen K, et al. Stress index can be accurately and reliably assessed by visually inspecting ventilator waveforms. Respir Care. 2018;63(9):1094-1101. PubMed ↩
-
Walkey AJ, Del Sorbo L, Hodgson CL, et al. Higher PEEP versus lower PEEP strategies for patients with acute respiratory distress syndrome: a systematic review and meta-analysis. Ann Am Thorac Soc. 2017;14(suppl 4):S297-S303. PubMed ↩